The Making of a Lake
I had the opportunity to be an explorer this week. Bob Izumi called and asked if I could join him shooting a show with Paul Michele and Darren Izumi. The show was about charting a lake with Navionics. The intention was to find a small uncharted lake and demonstrate how charts are made. Many of the charts in Canada and the U.S. are very old when a string and a weight was the only method of depth finding. How we read or display them might have changed but the information is the same.
Bob asked what lake we should do and I suggested Bass Lake north of Orillia. But when I looked at Navionics web app it had already been done. Next it was Lake St. John but it was done as well. We decided to go to Bark Lake which barely exists on maps never mind charts. There are no government charts even showing the outline.
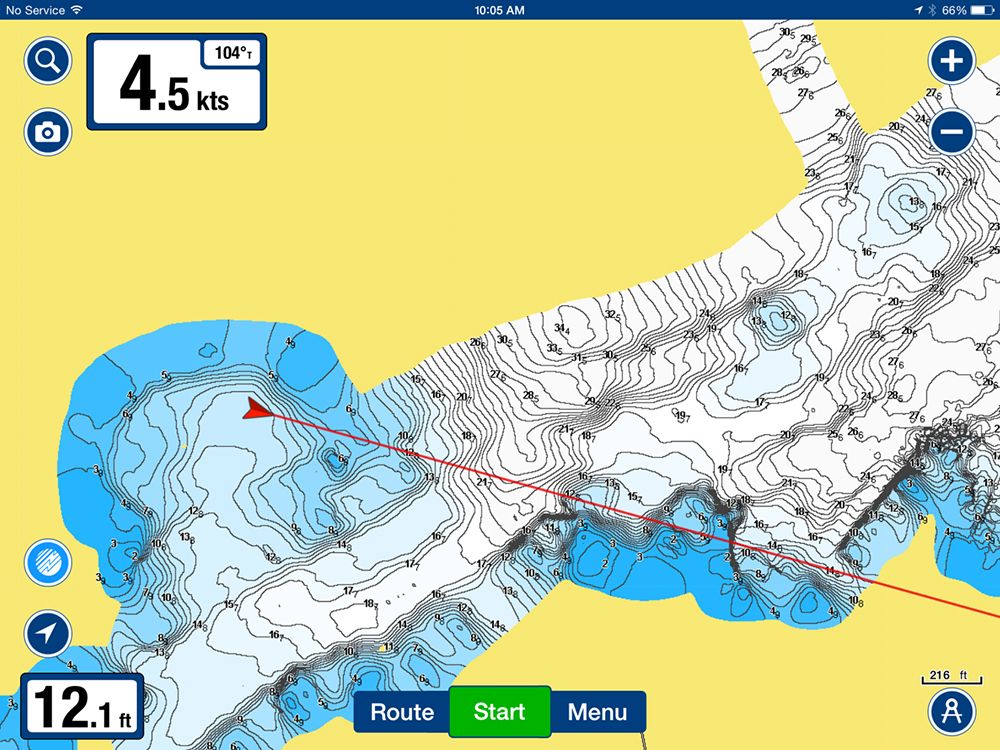
Paul, Darren and I launched Bobs new boat and chose a starting point. Paul added his iPad to the Lowrance network Wi-Fi and turned on the Navionics Sonar Charts. It was as simple as click record as we used the electric motor to cruise the shoreline. What happened from that point was amazing. An area of the bottom width of the transducer cone started to display on a blank screen. As we cruised it showed the contours being added and the outline of the shore. We traveled about 200 meters and turned around and used the maps track to parallel the original line and as we traveled the app would correct and equalize the bottom contour. We kept the grid close together near shore and added distance as the transducer cone would widen in deeper water.
In the first two hours we had recorded about 30% of the lake in great detail. It was as if we were scrapping off a covering layer and exposing the bottom. Every hump, ridge, and flat was detailed. There was rock piles that no one had found while fishing over the last 25 years. Once we were away from shore we could record at whatever speed the sonar would read the bottom. What was really amazing is that the Navionics sonar charts app on the iPad would show the course changes even fast than the Lowrance Gen 3.

The next morning we were on the water for 8:00 a.m. and continued the charting. Areas of interest were circled or crossed to get better definition as if we were painting a shape on the bottom. Paul is so proficient at this he could anticipate areas rising and at one point said to be careful. The autom light made it hard to see the bottom even in the shallows. Sure enough right after a warning we ran up on a rock. Good thing we were going so slowly. We detailed the area and marked a rock on the chart as we did several times. Four hours later we had charted the entire lake. What we thought was nothing more than a bowl with a few ridges and high points was now a complexed maze of humps and contours and drop offs. There were holes with depths of 40+ feet that we didnt know existed. The sharp one foot contour lines showed steep drops and walls and shelfs that were unknown in the past. Most importantly there were rocks we could hit in the middle of nowhere and they were now marked.
They say the last frontier is the bottom of the oceans. We now know the bottom of our lakes look very differently than we thought. Christopher Columbus would be proud of us. We now would have the option of sending the data file to Navionics where they would complete the shoreline with the latest satellite images. When this is done it becomes public to anyone with the latest updates. From that point anyone could submit a user community update which would be added at a later date. They can even mark boat launches or points of interest.
Then I got to thinking why would I want to show other anglers my newly discovered rock piles? Then I find out I can skip an area, submit the data and simply go over the area in fine detail after or in another session and use it as an overlay that just I have. I have the Navionics charts on my phone and tablet for ice fishing and planning, and I have it on my Lowrance units. The beauty of being chart independent is that I will always have my data for any units I choose to use in my boat or sled. All my way points can be kept on my phone or tablet so if I want to change sonar manufactures I wont lose my data or tracks because that company uses proprietary charts. Most of the charts used by manufactures are simply old NOAA charts with estimated detail.
Later that day Bob came up and we all went fishing and used the new charts. There is a certain comfort in seeing where you actually are and what you can hit. There is not likely going to be any public input to Bark Lake in the future because it is private access and there are much better places to fish anyway. But there are hundreds of lakes that are not charted or the information is wrong and sometimes dangerous as I found out on Georgian Bay when I took my lower unit off cruising through an area with old government data. In years to come other people will refine dangerous areas and that is the beauty of equipment independent chart apps. The whole community can update data.
We caught fish from several of the new structures we found. Our walleye dinner was the reward for our 6 hours of grid work. We could identify areas so quickly now. I will keep a copy of the new chart on my Android device and now that I know how easy it is I would send in areas that are dangerous for boaters. If I switch manufactures I can just use the data as an overlay on the existing charts.
Remember, the only thing that wont be obsolete in 5 years is the bottom of the lake.
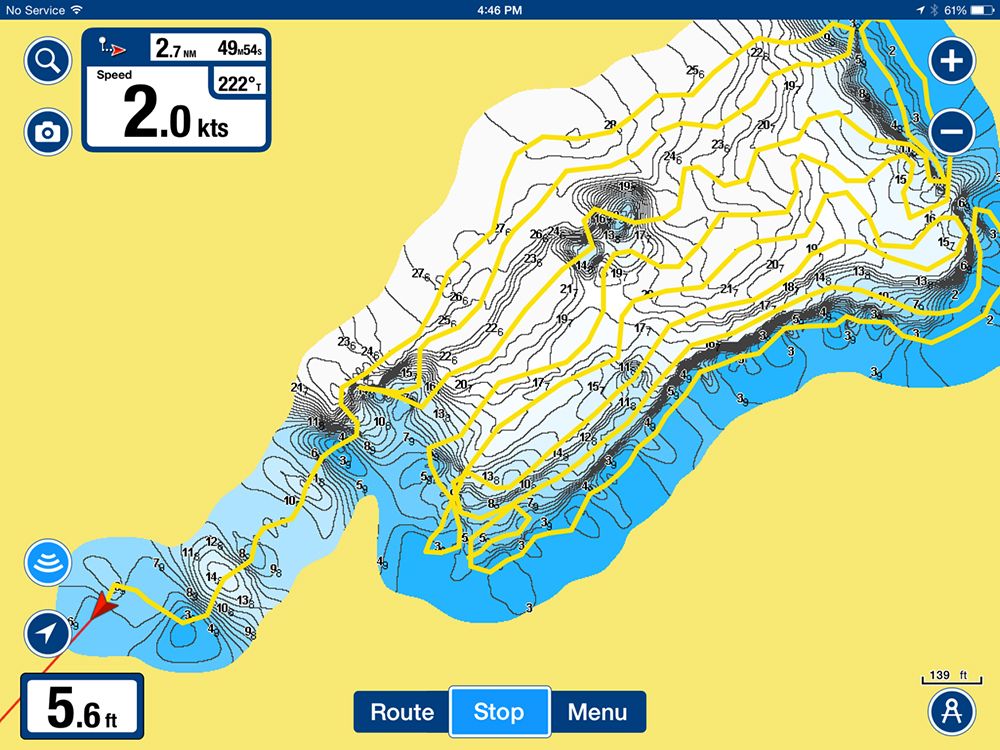
The track shows our grid pattern. Areas that had contour that might be estimated outside the cone of the transducer can be crossed over as often as it takes to get the detail you want. If you were out in the middle of a 30 foot deep flat you really don't need that much detail. But if you are charting an elongated shoal with a steep edge you might make several passes.
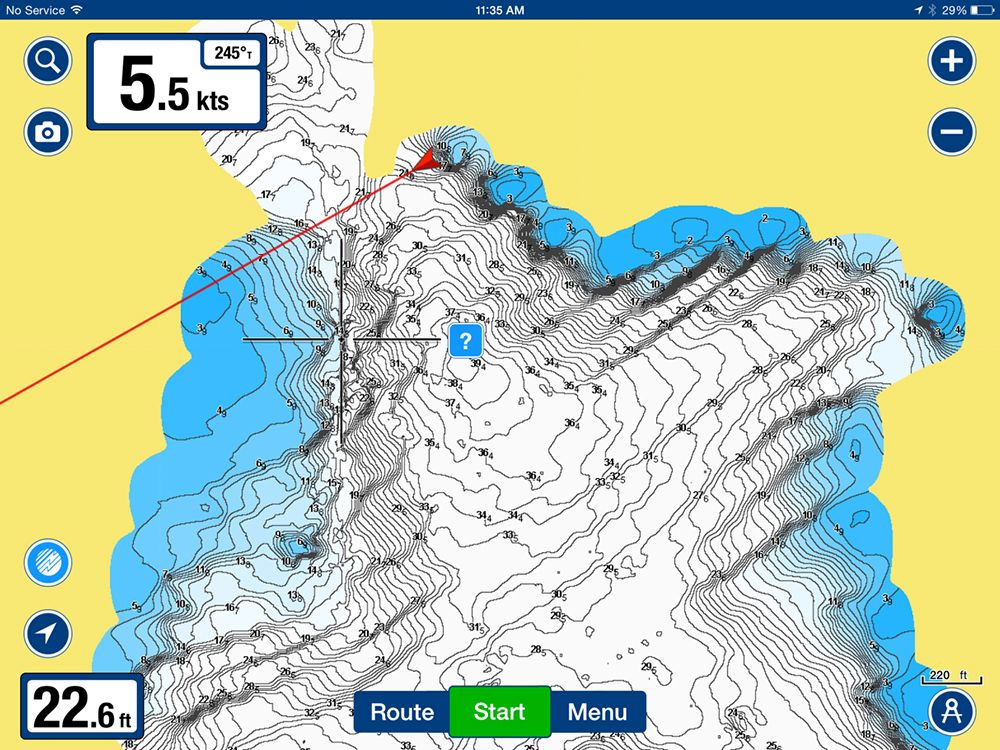
The waypoint is a rock which we can later label. The name of this rock is The $800 Repair Rock.
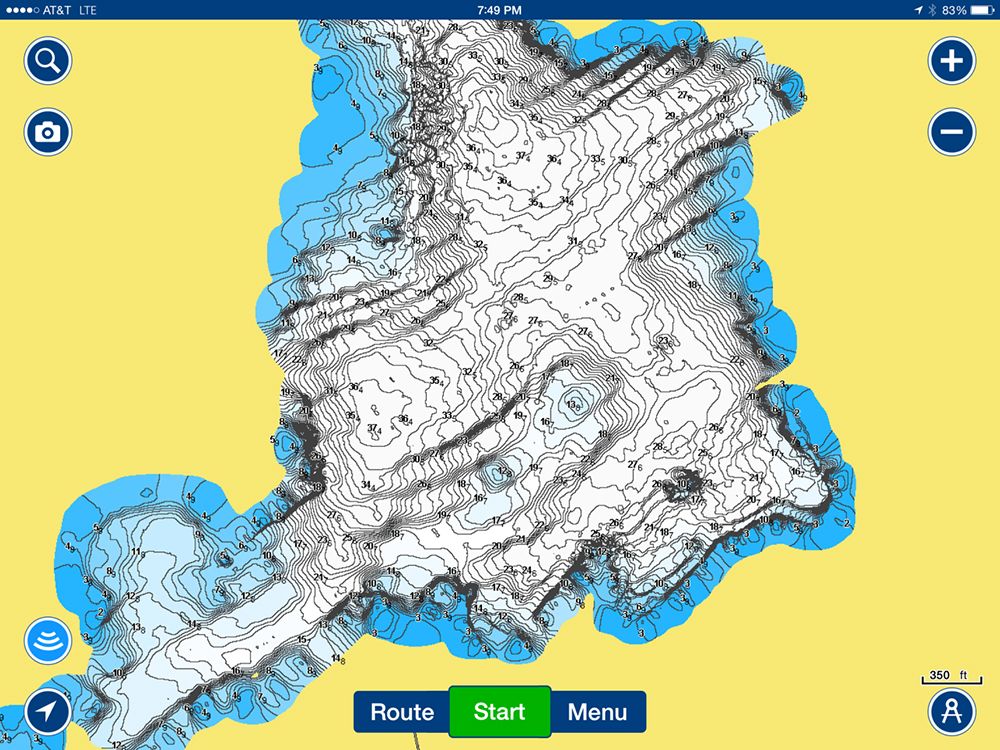
The finished product shows every contour, ridge, hump, and shelf. It looks busy from this view but once it is all equalized you can zoom in to get detail.


 Your Privacy Choices